

Trigger modes
Schedule types
When the Trigger is set to On Schedule, pick one of: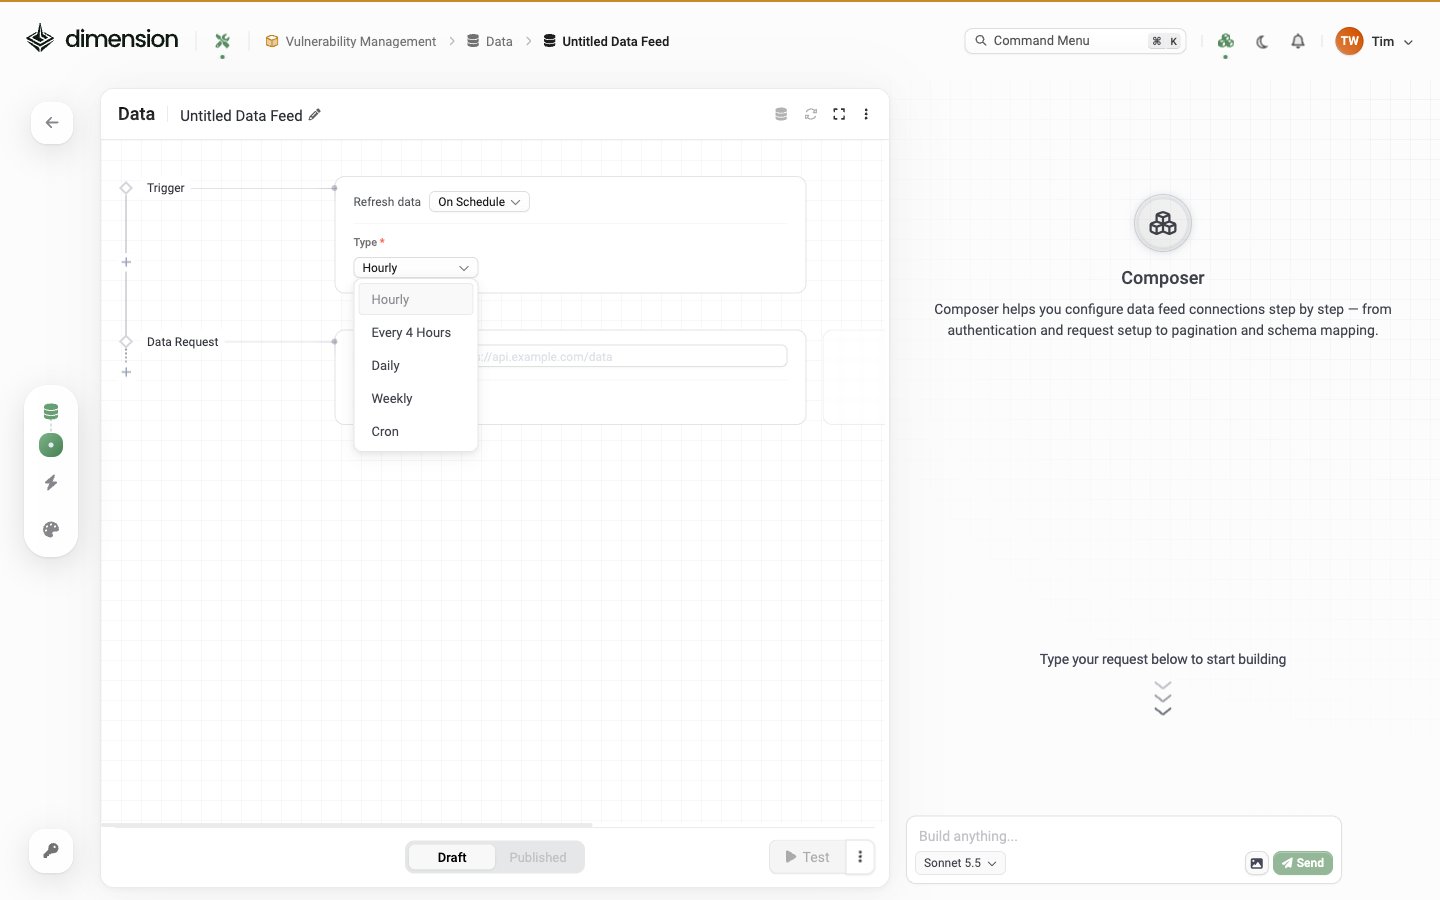
On-demand refresh
Three ways to manually trigger a feed run:- The Test button at the bottom of the Data Feed editor — runs the request once and shows the response inline (works on Draft and Published)
- The refresh icon in the Data Feed editor toolbar (top right of the canvas) — re-runs against the Published configuration
- A “Refresh” control in a Studio app that wires up to this feed — built by asking the Composer
A Data Feed must be Published before it can run on a schedule. Hover the refresh icon in an unpublished feed and you’ll see the message “Please publish this data feed in order to trigger a run.” The Test button works on Draft.
Request History
The full history of every sync run for a Feed lives under ⋯ → Advanced → Request History. Each row shows:- Run timestamp
- HTTP status code
- Number of records returned
- Duration
- Error message (if the run failed)
Querying the feed’s data
After a Feed runs, its data is available to Studio apps. Two ways to query:- Studio (Natural Language)
In the Studio Composer, describe what you need:The Composer translates natural language into queries against your Feed’s data.
Troubleshooting
Data Not Syncing
Data Not Syncing
Check:
- Feed is Published (Draft feeds don’t run on schedule)
- The Trigger is configured (Schedule + Type, or set to On Demand)
- Credentials in the Variables panel are still valid
- The source’s API is reachable from Dimension
- Open the feed editor and click refresh manually — error messages appear in the canvas
- Re-enter expired credentials and click the lock icon to encrypt
- Check the Audit Log under Settings → Logs for failed runs
Stale Data
Stale Data
Apps consume data as of the last successful Feed run. If a Studio app shows out-of-date data:
- Open the Feed and check its last-run timestamp
- Click refresh in the Feed editor to force a fresh run
- Reduce the schedule cadence (e.g. Hourly → Every 15 minutes via a Cron expression)
Missing Records
Missing Records
Check the schema mapping:
- Open the Feed and verify the Data Path points to the right array in the response
- Verify the ID Path points to a unique identifier
- Verify Pagination is configured if the source returns more than one page
Slow Queries from Studio
Slow Queries from Studio
Optimize:
- Reduce the Feed’s data volume — add filters to the URL or Params
- In Studio prompts, scope queries: “Show Windows devices with critical risk in the last 30 days” instead of “Show all devices”
- Use aggregations (
count,group by) instead of raw lists where possible
Adjusting frequency vs. cost
More frequent syncs = more API calls = potentially higher records-ingested usage against your quota.
Match the schedule to the data’s actual rate of change. Hourly is rarely needed for inventory data; daily is rarely fresh enough for live threat feeds.