A 15-minute walkthrough that takes you from the gallery to a working, published Studio app. We’ll use a simple example — a device count by department dashboard — but the pattern is the same for anything you’d build.

Prerequisites

  • An account that can enter Builder Mode (Super Admin or Analyst role)
  • A Workspace you can build in. The default Gallery workspace is read-only; create a personal workspace first if you don’t have one (see Workspaces)
  • Optional: at least one Data Feed connected, or use the standard ThreatAware Devices table

Step 1 — Enter Builder Mode

From the gallery, click the wrench icon next to the Dimension logo. The workspace overview opens with the Planner on the right and the left rail for Connect Data, Create Actions and Build Apps. Builder Mode workspace overview for Vulnerability Management showing its description and counters for 1 Data feed, 1 Action and 1 Studio app, with labels pointing to Toggle builder mode, Easily switch workspaces, Search across everything, Connect Data, Create Actions, Build Apps and Store Credentials, and the Planner panel on the right with a Build anything textbox
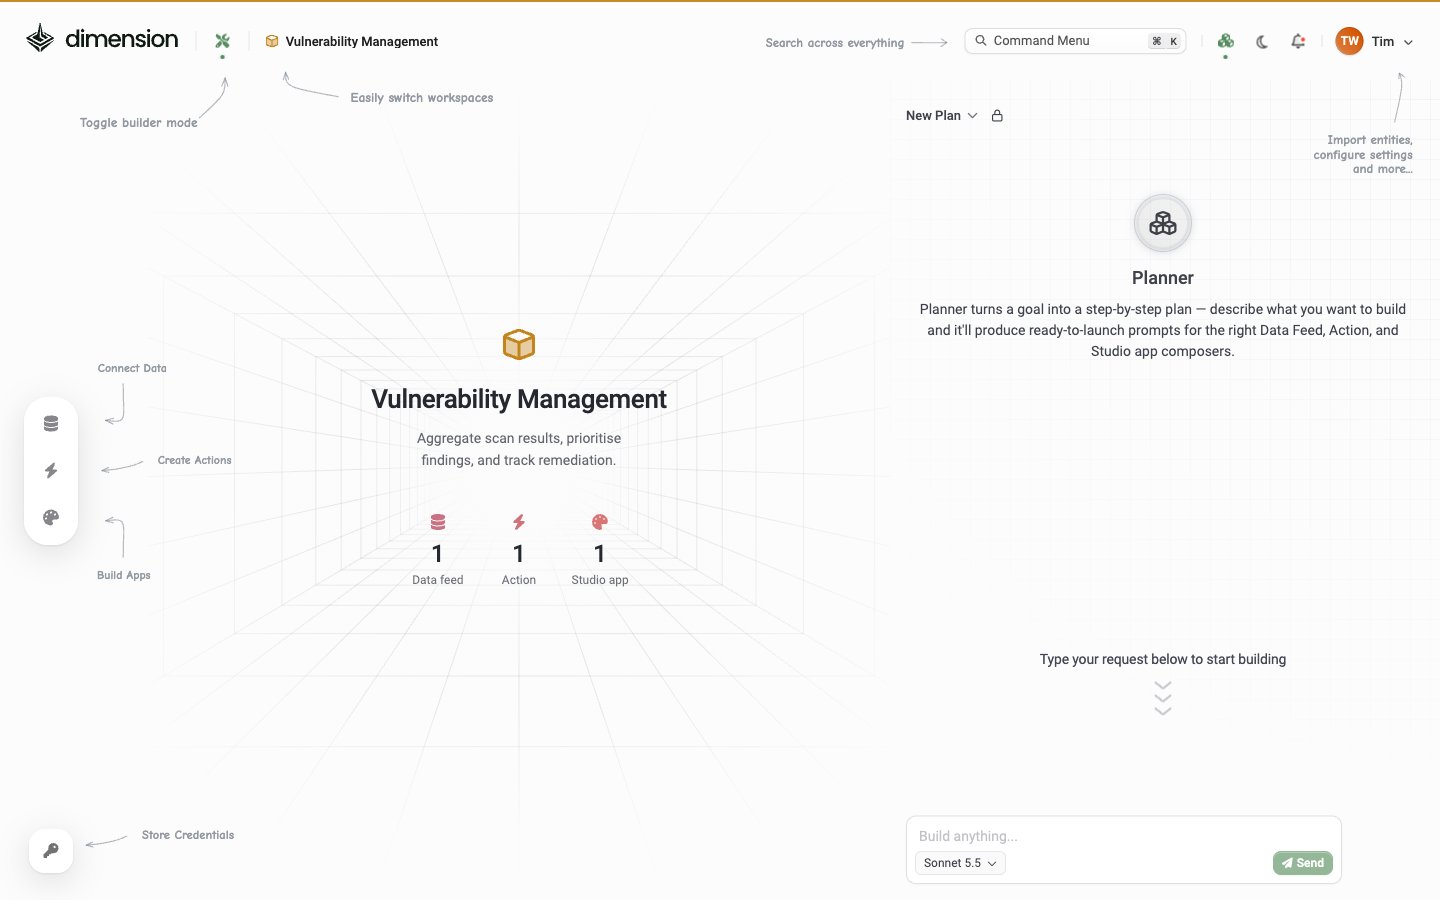
If you don’t have a workspace to build in yet, click the workspace chip in the header and create one. Keep yourself as the only person in its Access list for this walkthrough so the app stays yours while you experiment.

Step 2 — Start a new app

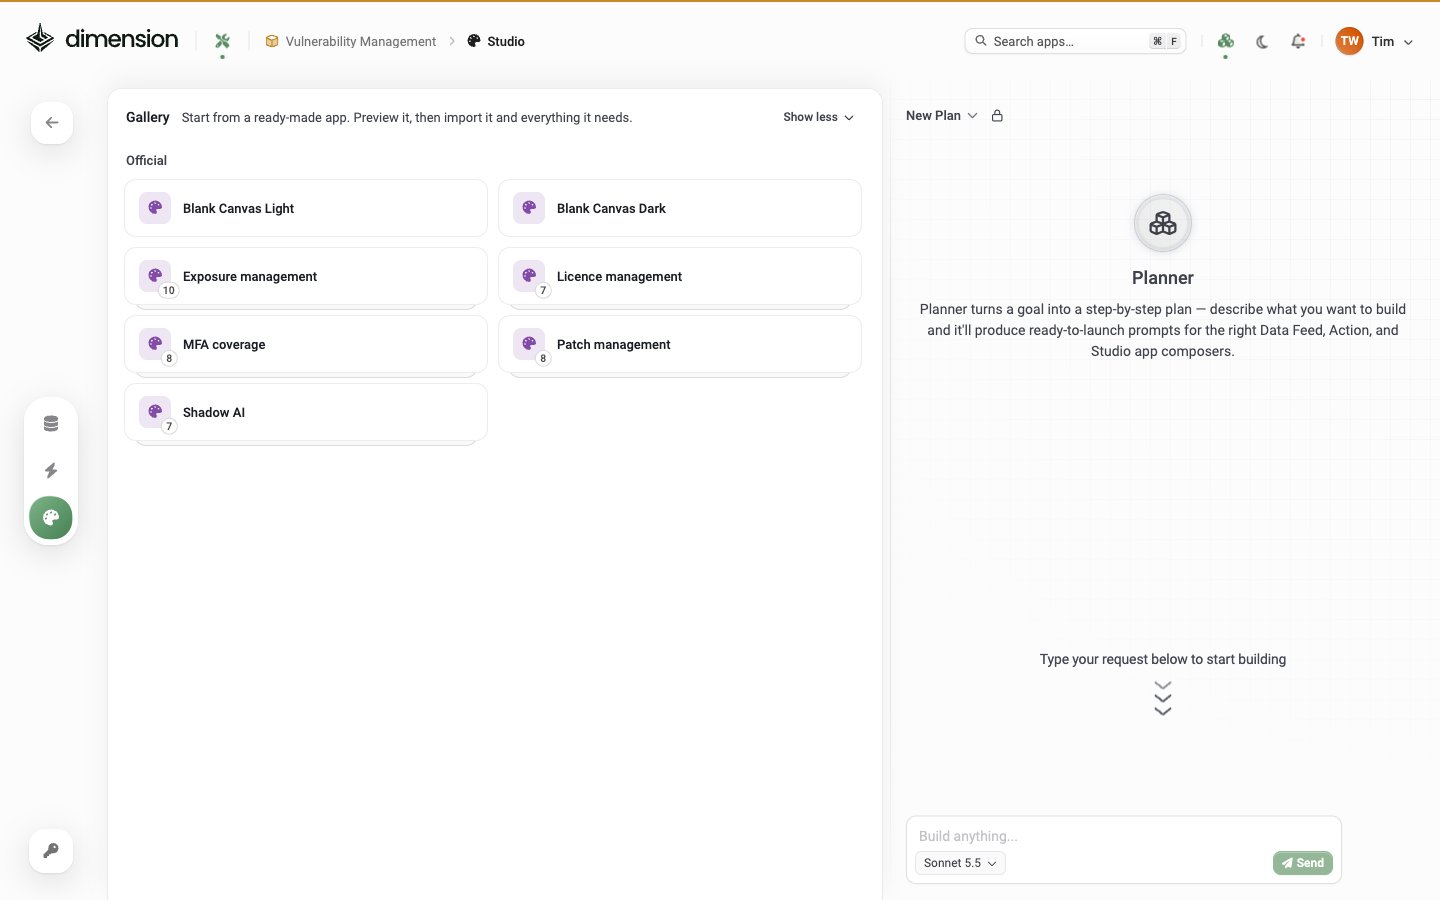
Open Build Apps (the palette icon in the left rail). The Studio apps list opens with the template gallery: Studio Gallery: Start from a ready-made app. Preview it, then import it and everything it needs. Official entries are Blank Canvas Light, Blank Canvas Dark, Exposure management, Licence management, MFA coverage, Patch management and Shadow AI, with the Planner on the right Pick Blank Canvas Light (or Dark — your call). You’ll land in the Studio editor with an empty canvas and an empty Composer chat panel on the right.
Step 3 — First prompt

In the Composer (right pane), type:
Press Send. Composer thinks for a few seconds (you’ll see Thought for X seconds), generates the React components, and renders them live in the preview. The chat shows a step-by-step trace:
  • Thought for 6.7 seconds
  • I'll build a clean, polished dashboard with...
  • ✓ Created App.tsx
  • ✓ Saved Changes
  • All done! Here's what was built: + bullet list

Step 4 — Confirm whether you have data

If this app needs external data and your workspace has none, Composer pops a “Did you forget to add a data feed?” confirmation: Confirmation dialog over a new Blank Canvas app: Did you forget to add a data feed? Studio apps greatly benefit from having data feeds available to generate rich reports, dashboards, and apps. Buttons: Cancel and Proceed with no data feeds
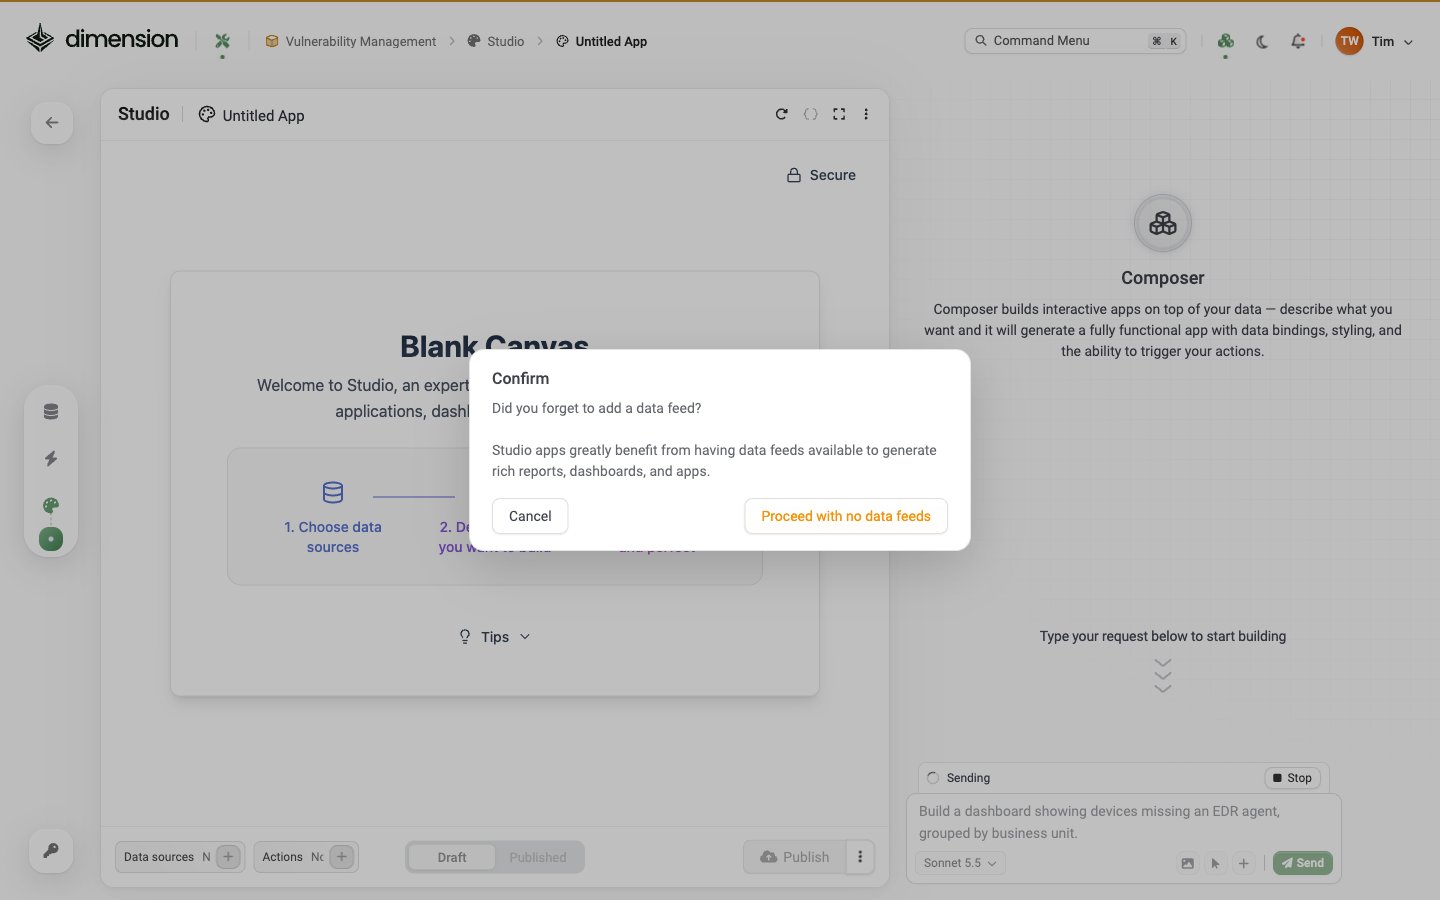
  • Proceed with no data feeds — for purely UI apps or when you’ll connect data later
  • Cancel — go and wire up a Data Feed first (Connect Your Data)
If you already have the ThreatAware Devices table available, the app builds with real data straight away — no prompt.

Step 5 — Iterate

Refine through conversation. Try:
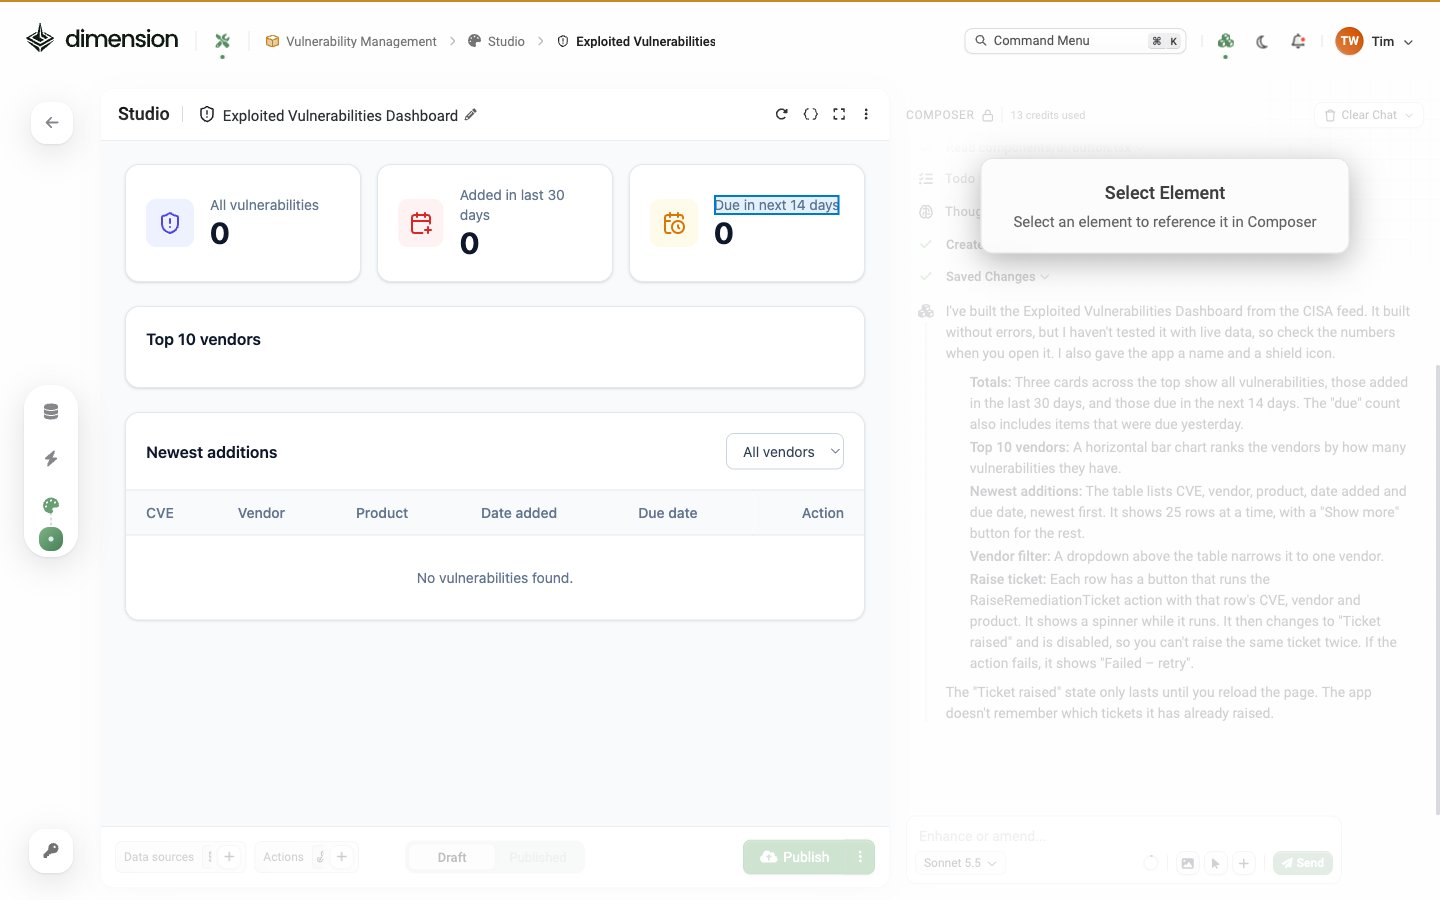
Each prompt updates the preview live. Use Inspect Component (the cursor icon in the Composer footer) to point at specific elements without naming them: Inspect Component selection mode active: the Composer pane is dimmed and a Select Element prompt reads Select an element to reference it in Composer, while the Due in next 14 days label in the app preview is outlined
Restore checkpoint — if a Composer round-trip goes sideways, scroll up to that message and click Restore checkpoint. The app reverts to the state after that message. See AI Composer → Restore checkpoint.

Step 6 — Wire up an Action (optional)

If you want a button on each row that opens a Jira ticket, first create a Webhook Action targeting Jira. Then in Studio:
Composer wires the button to the Action, including the input mapping.

Step 7 — Polish

Common polish prompts:
The PDF button is built-in via ⋯ → Generate PDF — you can either rely on that or surface a button in-app for end users.

Step 8 — Publish

Click Publish at the bottom-right of the editor (see Draft and published). Dimension:
  • Promotes Draft → Published
  • Auto-creates a Shortcut using the app’s name as the slug
  • Fires a Publish app notification in the bell-icon panel
  • Records the publish in the Audit Log
Who can see the published app follows the workspace’s Access list. If everyone in your tenant has access to the workspace, everyone can see the app. If only you do, only you see it.

Step 9 — Share or pin

Once published:

What you just built

In ~15 minutes you’ve got:
  • A live dashboard with real data
  • Branded look-and-feel
  • Auto-refresh
  • A button that opens tickets
  • A published, shareable URL
  • A PDF export
All in conversation, no code.

Where to go next

Tutorials

More step-by-step walkthroughs — License Tracker, SOC Dashboard, Compliance Scorecard, Patch Tracker

AI Composer

Deeper coverage of prompts, Inspect, component templates, and Restore checkpoint

Components

The full 46-component library

Exporting & Sharing

PDF, Clone, Share URL, Migrate, X-Ray